Artificial Analysis Launches VIALS-AA Benchmark for Scientific Image Reasoning
Artificial Analysis has released VIALS-AA, its implementation of Handshake AI's VIALS benchmark, running 161 scientific image tasks three times each via its open-source Stirrup harness. Models frequently answer incorrectly even after extensive image inspection, and reach correct answers through markedly different reasoning paths.
Full Report
Contents29 sections
November 6, 2026
VIALS-AA: different paths to scientific image reasoning
VIALS-AA is our implementation of Handshake AI's VIALS benchmark, testing whether language models can interpret scientific images and answer questions about the evidence they contain. Models take different paths to a correct answer, and often get questions wrong even after extensively inspecting the images.
VIALS-AA leaderboardRead the methodologyExplore the tracesThis is the launch article and shows VIALS-AA results as of November 6, 2026. For current results, see the VIALS-AA leaderboard.
Overview
VIALS-AA tests whether models can interpret scientific images and answer questions about the evidence they contain. We run each of its 161 tasks three times with Stirrup, our open source reference harness, giving models code execution and image inspection tools. The results show differences in both reliable task success and the amount of work models do to reach an answer.
Key findings
- Gemini 4 Carbon (high) leads with a score of 64%. It answers all three repeats correctly on 103 of 161 tasks, two more than GPT-6 Astra (max). Gemini 4 Carbon (high), GPT-6 Luna (max), GPT-6.1 Sol (max), GPT-6.1 Terra (max), and GPT-6 Astra (max) make up the score–cost Pareto frontier among the models tested
- More turns and visual inspection don't always get better results. Claude Sonnet 5.5 (max, with fallback) and GPT-6.1 Sol (max) score similarly on VIALS-AA (60% and 59%, respectively), but Claude Sonnet 5.5 makes 3.6× as many tool calls per task
- Consistency separates models with similar pass@3 rates. Kimi K3.1 Pro (max) and GPT-6 Astra (max) each solve around three-quarters of tasks at least once. Requiring all three repeats to succeed separates their scores: 45% for Kimi K3.1 Pro (max) versus 63% for GPT-6 Astra (max). We require all three because a result that changes between runs cannot be relied on in scientific work
- Cost per task varies nearly 99×. It ranges from 1.77 for Grok 4.7 (xhigh). GPT-6.1 Sol (max) scores 59% at $0.06 per task, about a thirtieth of the cost of Claude Opus 5.5 (max, with fallback) for similar performance (61%)
VIALS-AA: Score
Share of tasks answered correctly in all three repeats (pass^3)No publicly available API{"@context":"https://schema.org","@type":"Dataset","name":"VIALS-AA: Score","creator":{"@type":"Organization","name":"Artificial Analysis","url":"https://artificialanalysis.ai"},"description":"Share of tasks answered correctly in all three repeats (pass^3) · Evaluation results measured independently by Artificial Analysis","variableMeasured":[{"@type":"PropertyValue","name":"V I A L S- A A"}],"measurementTechnique":"Independent test run by Artificial Analysis on dedicated hardware.","spatialCoverage":"Worldwide","keywords":["analytics","llm","AI","benchmark","model","gpt","claude"],"license":"https://artificialanalysis.ai/docs/legal/Terms-of-Use.pdf","isAccessibleForFree":true,"citation":"Artificial Analysis (2025). LLM benchmarks dataset. https://artificialanalysis.ai"}
VIALS-AA: Score vs. Cost per Task
VIALS-AA Score · Cost per task (USD)Most attractive quadrantPareto lineAnthropicDeepSeekGoogleZ AIOpenAISpaceXAIKimiXiaomiMiniMaxMistralMetaAlibaba
Evaluation Cost per Task
Cost is calculated from input, cache-read, cache-write, reasoning, and answer token prices, divided by the task count. Token usage is averaged across the 3 independent repeats per task, using each model's representative cache hit rate. Costs include contestant model calls only; judge calls are excluded.
Example trajectories: different paths through scientific images
The first task asks models to locate protein spot 22 in a gel electrophoresis image and estimate its molecular-weight range from the vertical axis. Models take different paths: a short visual inspection, explicit measurement, or repeated checks using annotations and processed views. With Grok 4.7 (xhigh), we see extensive inspection and annotation still end in a wrong answer.
Task 1Protein spot 22Task 2Validate the FMO controlsTask 3Read a plasmid digestTask 4Count hydrophobic contactsTask 5Find the shared ancestor
Short inspection and explicit measurement can both work
Short visual inspection
GPT-6 Astra (max) checks the image dimensions, opens the original, makes a 4× enlargement, and opens it. It then writes the correct answer and finishes in six turns. It makes no pixel measurements or contrast adjustments and draws no reference lines, relying on its visual accuracy to answer correctly without additional tool use.
- Turn 1
Inspect the image file
total 78
drwxr-xr-x 1 root root    70 Nov  3 04:55 .
drwxr-xr-x 1 root root   100 Nov  3 07:47 ..
-rw-r--r-- 1 root root     0 Nov  3 04:57 answer.txt
-rw-r--r-- 1 root root 78963 Nov  3 04:55 image.jpg
(412, 409)
Recorded tool output excerpt 2. Turn 2
Open the original
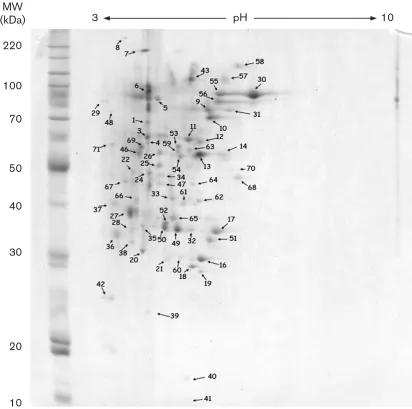
image.jpg · 412 × 409 px 3. Turn 3
Create a 4× enlargement
enlarged.png
1648 × 1636 px
Created, not yet viewed 4. Turn 4
Inspect the enlargement
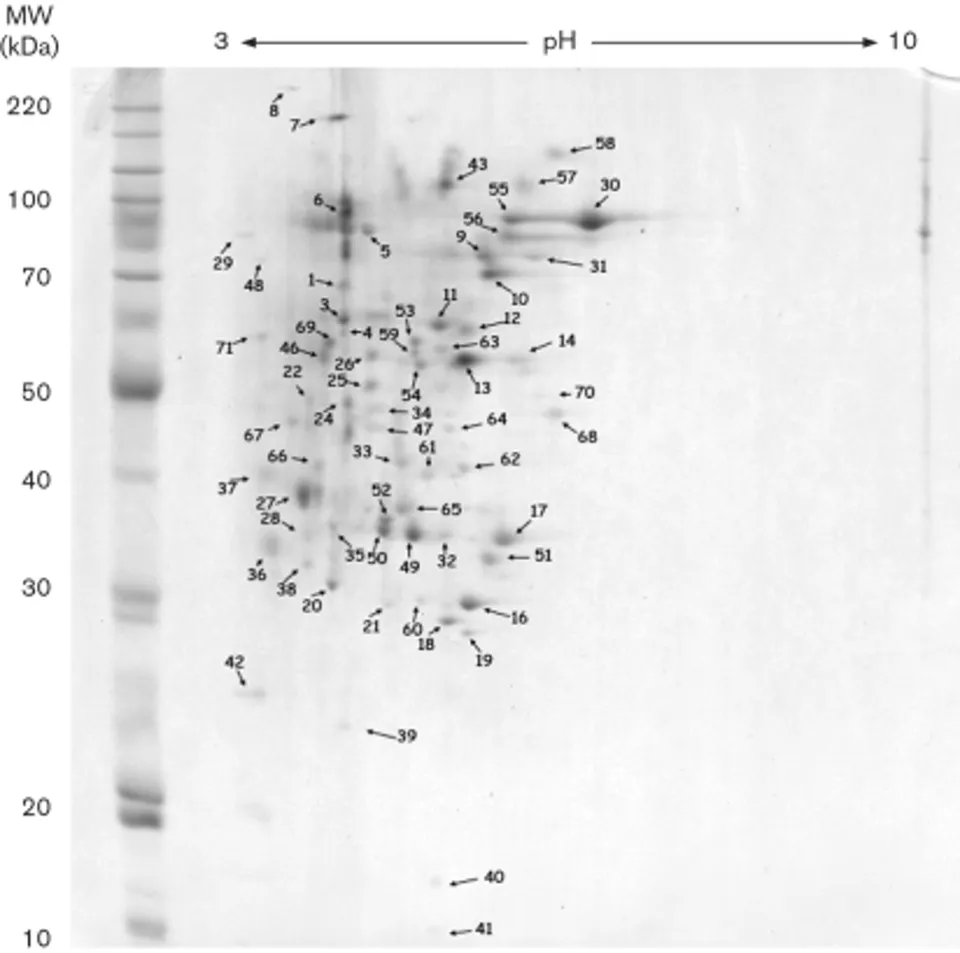
enlarged.png · 1648 × 1636 pxCreated in turn 3 5. Turn 5
Submit the answer
40-50 kDa
Pass
Reference: 40-50 kDa
Explicit measurement and calculation
Claude Sonnet 5.5 (max) enlarges the gel and crops the region around spot 22. It measures the ladder bands, inspects pixels near the arrow, draws reference lines, enhances contrast, and interpolates molecular weight. These explicit measurements check the spot's position against the ladder and support the 40-50 kDa answer. It finishes in 18 turns.
- Turn 4
Inspect a 3× enlargement
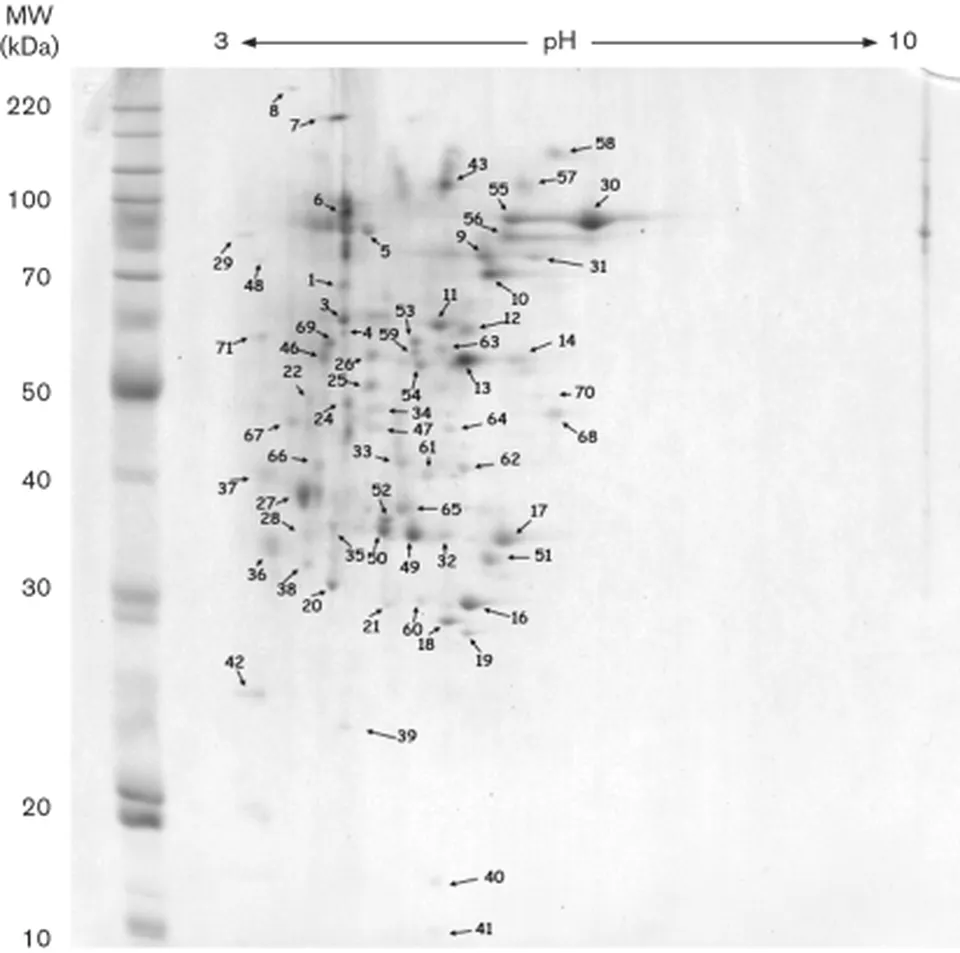
big.png · 1236 × 1227 pxCreated in turn 3 2. Turn 6
Inspect a 6× crop
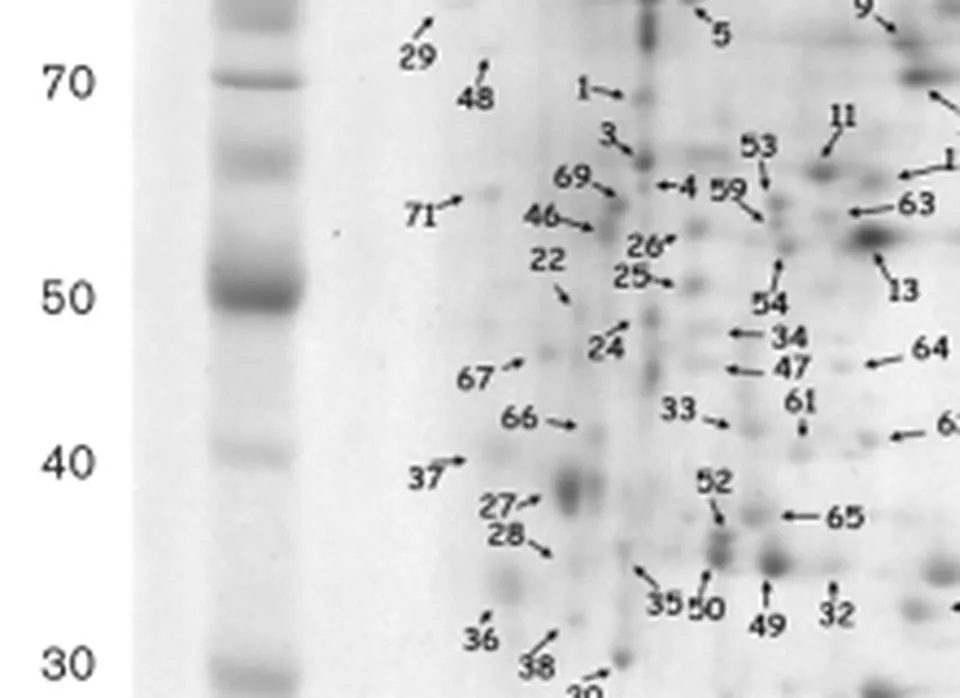
crop22.png · 1320 × 960 pxCreated in turn 5 3. Turn 15
Enhance contrast and check guides
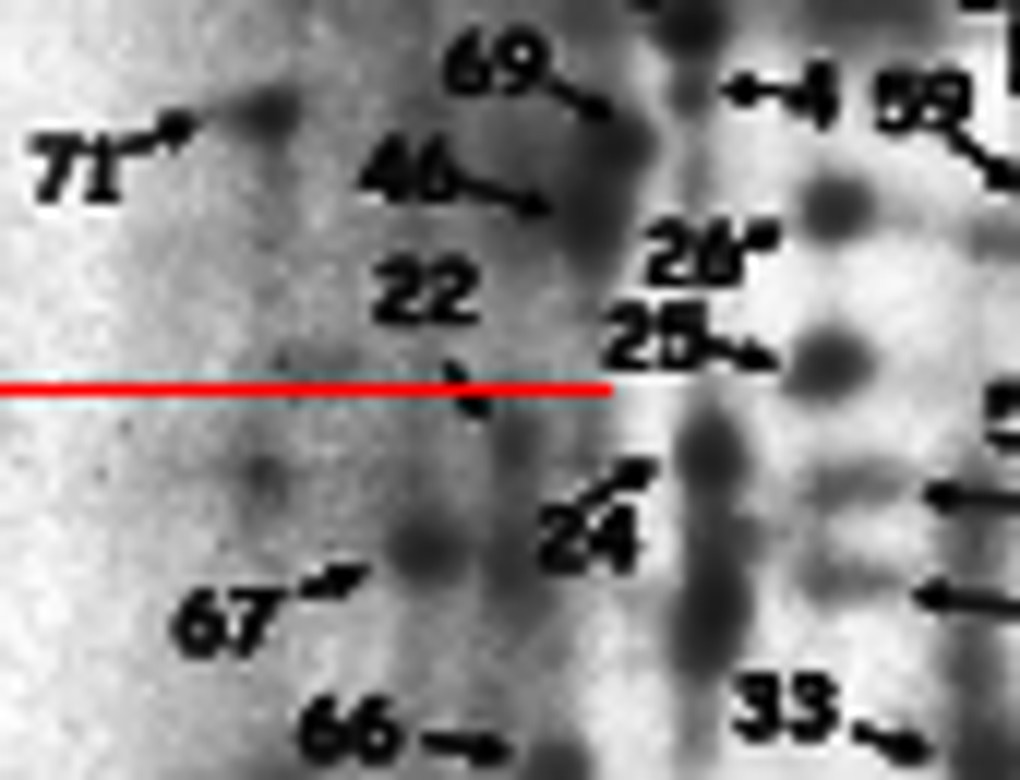
clahe22.png · 1020 × 780 pxCreated in turn 14 4. Turn 16
Interpolate molecular weight
22 number label centre     y= 159.0  MW(log-linear)= 53.0 kDa   MW(pchip)= 52.7 kDa
arrowhead tip              y= 168.5  MW(log-linear)= 49.7 kDa   MW(pchip)= 49.7 kDa
faint spot centre          y= 172.0  MW(log-linear)= 48.7 kDa   MW(pchip)= 48.6 kDa
spot lower extent          y= 174.0  MW(log-linear)= 48.1 kDa   MW(pchip)= 48.0 kDa
Recorded tool output excerpt 5. Turn 17
Submit the answer
40-50 kDa
Pass
Reference: 40-50 kDa
Repeated checks (that end in a visual error)
Grok 4.7 (xhigh) repeatedly checks the region using grids, thresholds, reference lines, and labeled pixels. It uses 27 turns and 20 image views, but answers 50-70 kDa. In its final annotated view, Grok circles the printed “22” in orange and the arrow tip in red, placing the tip on its green 50 kDa guide. Its final answer cites the label and leader to justify 50-70 kDa. This suggests it anchors the range on the annotation rather than the faint protein spot. Interpolation by Claude Sonnet 5.5 (max) separates the label (about 53 kDa) from the spot (about 48.7 kDa), supporting the reference range of 40-50 kDa.
- Turn 9
Inspect a coordinate grid
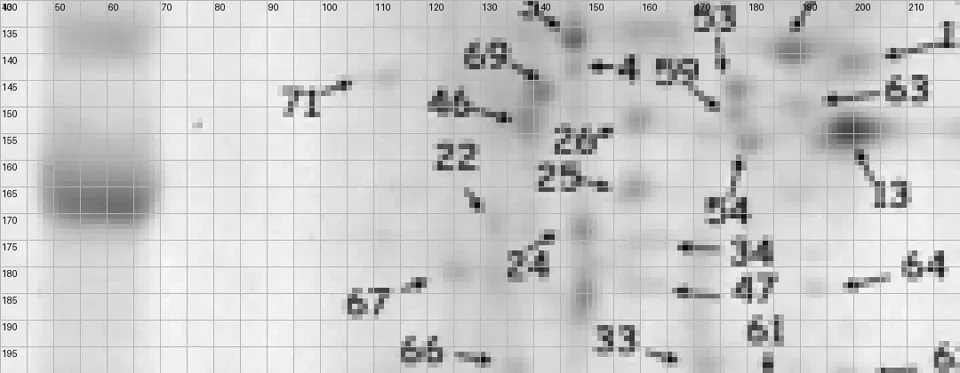
z22.png · 1080 × 420 pxCreated in turn 8 2. Turn 16
Inspect molecular-weight guides
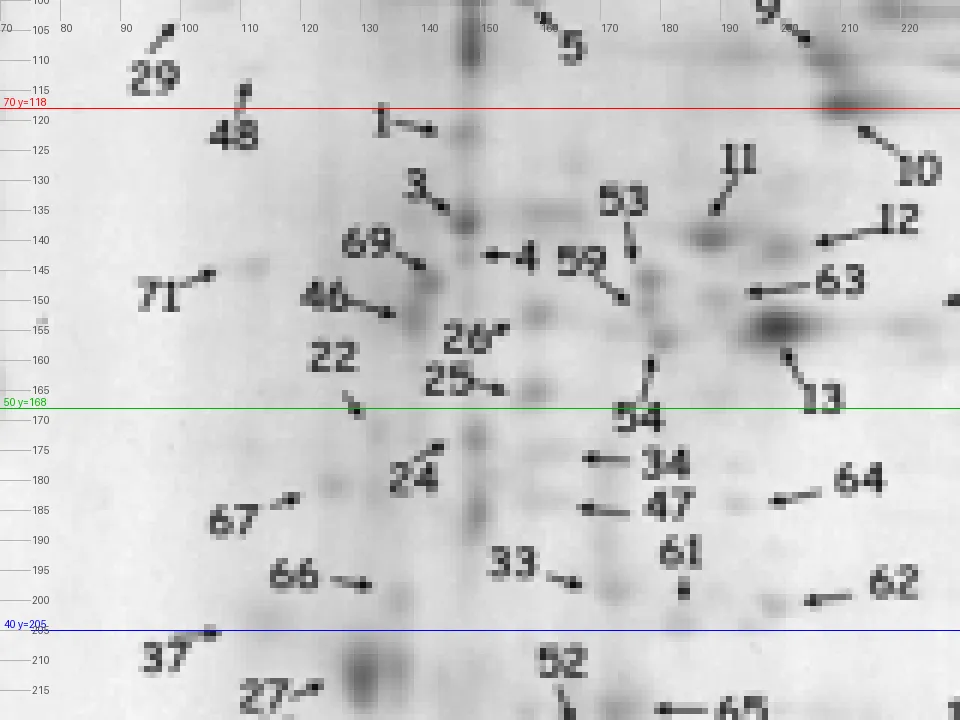
z22_lines.png · 960 × 720 pxCreated in turn 15 3. Turn 19
Label individual pixels
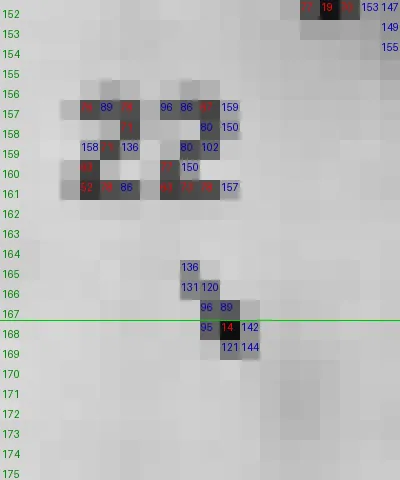
pixel22.png · 400 × 480 pxCreated in turn 18 4. Turn 25
Inspect the label and arrow tip
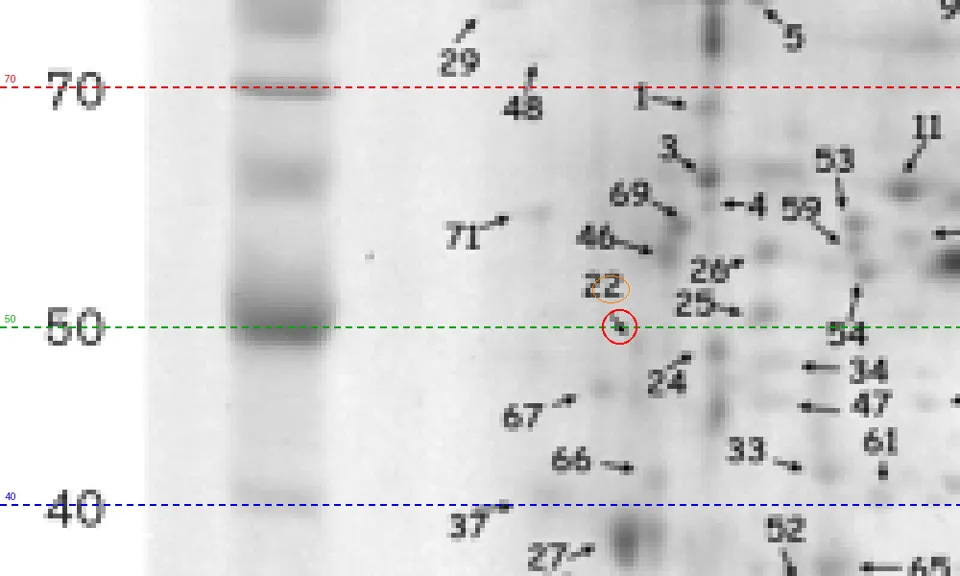
decision.png · 1000 × 600 pxCreated in turn 24 5. Turn 26
Submit the wrong range
50-70 kDa
Fail
Reference: 40-50 kDa
Interpreting images without native vision
Vision-enabled models are a natural fit for VIALS-AA: they can inspect a scientific figure, read its labels, and relate visual features to the question. We also wanted to test how a model without native vision would approach these tasks. We gave GLM-5.3 (max) the same image files and code execution, allowing it to investigate the figure through tools.
Without native vision, the model relies on code to extract evidence from the image. In the spot-22 trajectory below, GLM-5.3 (max) loads the image into arrays, enlarges and thresholds regions for OCR, compares pixel intensities, and prints coordinates and text maps of the image. It uses those outputs to locate labels, measure the molecular-weight scale, and choose a candidate spot. Each round of code returns another piece of evidence for the model to interpret and refine.
This selected pair shows the extra work involved, along with its limits. GLM-5.3-Flash (max) combines code with ten image views and finishes in 30 turns with the correct range. GLM-5.3 (max) takes 54 turns and 57 code calls, with no image views, and answers incorrectly.
Tool usage differs vastly between models
We classified tool calls across all 19 models in our original test set, covering 9,177 rollouts. Most calls were about visual evidence. 38.3% of tool calls were viewing images, while 47.3% prepared or measured them, creating crops, enhancing views, and extracting measurements from pixels. Image measurement accounted for just 5–6% of tool calls for GPT-6 Astra (max) and GPT-6.1 Sol (max), compared with 25–27% for Claude Opus 5.5 (max) and Claude Sonnet 5.5 (max).
Calls per TaskShare of Calls
VIALS-AA: Tool Calls per Task
Mean tool calls per task, averaged over three independent repeatsNo publicly available APIImage ViewingImage PreparationImage MeasurementCommentary / No-opOther{"@context":"https://schema.org","@type":"Dataset","name":"VIALS-AA: Tool Calls per Task","creator":{"@type":"Organization","name":"Artificial Analysis","url":"https://artificialanalysis.ai"},"description":"Mean tool calls per task, averaged over three independent repeats · Evaluation results measured independently by Artificial Analysis","variableMeasured":[{"@type":"PropertyValue","name":"Image_viewing"},{"@type":"PropertyValue","name":"Image_preparation"},{"@type":"PropertyValue","name":"Image_measurement"},{"@type":"PropertyValue","name":"Commentary_noop"},{"@type":"PropertyValue","name":"Other"}],"measurementTechnique":"Independent test run by Artificial Analysis on dedicated hardware.","spatialCoverage":"Worldwide","keywords":["analytics","llm","AI","benchmark","model","gpt","claude"],"license":"https://artificialanalysis.ai/docs/legal/Terms-of-Use.pdf","isAccessibleForFree":true,"citation":"Artificial Analysis (2025). LLM benchmarks dataset. https://artificialanalysis.ai"}
Evaluation Tool Calls
Calls that finish or abandon the task are excluded from tool-call counts. Per-task values are averaged across recorded repeats, with up to 483 observations per model. Tool calls per turn is the total number of counted tool calls divided by the total number of completed model turns. Repeats without a recorded turn count, such as an immediate safety block, are excluded.
How we categorize tool calls
| Category | Includes |
|---|---|
| Image Viewing | Original images; crops and other processed views |
| Image Preparation | Cropping; zooming/resizing; rotation; contrast/brightness adjustments; annotations and guides; masks/false colors; ASCII renderings |
| Image Measurement | Object counts; areas; band intensities; intensity profiles; coordinates; distances; structural relationships; plots of measurements |
| Commentary / No-op | Comments; empty code; static narration or reasoning |
| Other | - OCR: text and label extraction from pixels - Calculation: numerical, statistical, symbolic, or scientific calculations - Inspection/setup: files, dimensions, metadata, dependencies, saved results, helper scripts - Answer writing: final answer file creation, formatting, readback - Other/unclear: uncategorized activity or insufficient evidence |
One primary category per call, based on its main activity.
Image viewing comes from the view_image tool; the other activity groups classify code_exec calls. Other includes file and environment inspection, answer writing, calculation, OCR, and unclear activity. OCR accounts for 12.4% of Other calls; Gemini 3.8 Flash (high) accounts for 21% of OCR calls.
Not every code execution does analysis
Gemini 3.8 Flash (high) accounts for 86.7% of the cohort’s calls classified as commentary/no-op. This represents 5.6% of its tool calls, or about 3.8 of its 67.5 calls per task.
commentary/no-op tool calls cover static narration, comments, or printed text without new computation or file analysis. In Protein spot 22, a commentary/no-op tool call prints an interpretation of the spot labels. The code execution tool acts as a notepad: the model writes out its interpretation and the text returns in the next model request.
More intelligent models tend to call fewer tools
Models with higher Artificial Analysis Intelligence Index scores generally make fewer tool calls on VIALS-AA.
But similar VIALS-AA scores can come from very different inspection strategies: Opus and Sonnet make substantially more tool calls and image measurements than Astra and Sol.
Intelligence IndexVIALS-AA ScoreTool Activity
VIALS-AA: Tool Use vs. Intelligence
Each point is one model across the same 161 tasks and three independent repeatsMost attractive quadrant
Models solve similar numbers of tasks, but top scorers are far more consistent
Leading open weights models solve about as many tasks at least once as closed frontier models, but are much less consistent. Kimi K3.1 Pro (max), MiMo-V2.6-Pro, and MiniMax-M3.1-Flash (max) each solve 114–119 tasks at least once, against 111–118 for the seven top-scoring models, all closed. They pass all three repeats on only 48–73 tasks, against 95–103. Our headline metric, pass^3, is the share of tasks answered correctly in all three repeats. We use pass^3 because inconsistent answers in scientific work can lead to wrong conclusions and costly follow-up experiments.
ConsistencyAll MetricsAverage of 3pass@3 Rate
VIALS-AA: Consistency Across Three Repeats
Share of tasks passing zero, one, two, or all three repeatsNo publicly available API0/3 Passes1/3 Passes2/3 Passes3/3 Passes
Gemini 4 Carbon (high) leads in three of eight domains
Gemini 4 Carbon (high) leads or shares the lead in three of the eight domain groups: plasmid maps, phylogenetics, and flow cytometry. It shares the flow-cytometry lead with Gemini 4 Argon (high). Claude Opus 5.5 (max) leads on blotting, Claude Sonnet 5.5 (max) on cell counting, and GPT-6.1 Terra (max) on protein structure/binding. GPT-6 Astra (max) and GPT-6.1 Sol (max) share the lead on molecular structure.
VIALS-AA: Score by Domain
Share of tasks answered correctly in all three repeats by scientific domain. Colors are normalized within each domain across all models tested{"@context":"https://schema.org","@type":"Dataset","name":"VIALS-AA: Score by Domain","creator":{"@type":"Organization","name":"Artificial Analysis","url":"https://artificialanalysis.ai"},"description":"Share of tasks answered correctly in all three repeats by scientific domain. Colors are normalized within each domain across all models tested · Evaluation results measured independently by Artificial Analysis","variableMeasured":[{"@type":"PropertyValue","name":"Vials Pass All3 By Domain"}],"measurementTechnique":"Independent test run by Artificial Analysis on dedicated hardware.","spatialCoverage":"Worldwide","keywords":["analytics","llm","AI","benchmark","model","gpt","claude"],"license":"https://artificialanalysis.ai/docs/legal/Terms-of-Use.pdf","isAccessibleForFree":true,"citation":"Artificial Analysis (2025). LLM benchmarks dataset. https://artificialanalysis.ai"}
Cost per Task varies by nearly 100× across models
Cost per task ranges from 1.77 for Grok 4.7 (xhigh), a 99× spread. GPT-6.1 Sol (max) and Claude Sonnet 5.5 (max) score 59% and 60%, respectively, but Sonnet costs about 18× as much per task.
Output tokens per task range from about 2.21k for GPT-6 Astra (max) to 94.6k for MiMo-V2.6-Pro, a 43× spread. Reasoning makes up most of each model’s output. Claude Sonnet 5.5 (max) uses 63.5k, including 54.6k reasoning tokens: about 25× as many output tokens as GPT-6.1 Sol (max) for a similar score.
Cost per Taskpass@3 vs. Cost
VIALS-AA: Cost per Task
Mean cost (USD) per task to run VIALS-AA, calculated from token usage and model pricing including representative cache hit ratesNo publicly available APIAnswerReasoningCache WriteCache HitInput{"@context":"https://schema.org","@type":"Dataset","name":"VIALS-AA: Cost per Task","creator":{"@type":"Organization","name":"Artificial Analysis","url":"https://artificialanalysis.ai"},"description":"Mean cost (USD) per task to run VIALS-AA, calculated from token usage and model pricing including representative cache hit rates · Evaluation results measured independently by Artificial Analysis","variableMeasured":[{"@type":"PropertyValue","name":"Answer"},{"@type":"PropertyValue","name":"Reasoning"},{"@type":"PropertyValue","name":"Cache Write"},{"@type":"PropertyValue","name":"Cache Hit"},{"@type":"PropertyValue","name":"Input"}],"measurementTechnique":"Independent test run by Artificial Analysis on dedicated hardware.","spatialCoverage":"Worldwide","keywords":["analytics","llm","AI","benchmark","model","gpt","claude"],"license":"https://artificialanalysis.ai/docs/legal/Terms-of-Use.pdf","isAccessibleForFree":true,"citation":"Artificial Analysis (2025). LLM benchmarks dataset. https://artificialanalysis.ai"}
Evaluation Cost per Task
Cost is calculated from input, cache-read, cache-write, reasoning, and answer token prices, divided by the task count. Token usage is averaged across the 3 independent repeats per task, using each model's representative cache hit rate. Costs include contestant model calls only; judge calls are excluded.
Output Tokens per TaskScore vs. Output Tokens per Task
VIALS-AA: Output Tokens per Task
Mean reasoning and answer tokens consumed per VIALS-AA taskNo publicly available APIAnswerReasoning{"@context":"https://schema.org","@type":"Dataset","name":"VIALS-AA: Output Tokens per Task","creator":{"@type":"Organization","name":"Artificial Analysis","url":"https://artificialanalysis.ai"},"description":"Mean reasoning and answer tokens consumed per VIALS-AA task · Evaluation results measured independently by Artificial Analysis","variableMeasured":[{"@type":"PropertyValue","name":"Answer"},{"@type":"PropertyValue","name":"Reasoning"}],"measurementTechnique":"Independent test run by Artificial Analysis on dedicated hardware.","spatialCoverage":"Worldwide","keywords":["analytics","llm","AI","benchmark","model","gpt","claude"],"license":"https://artificialanalysis.ai/docs/legal/Terms-of-Use.pdf","isAccessibleForFree":true,"citation":"Artificial Analysis (2025). LLM benchmarks dataset. https://artificialanalysis.ai"}
Evaluation Output Tokens per Task
The number of answer and reasoning tokens per task, averaged across the 3 independent repeats.
VIALS-AA resources
- The leaderboard is on the VIALS-AA evaluation page
- The methodology page covers the current implementation, grading, and scoring
- Handshake AI’s VIALS benchmark page describes the dataset and original evaluation
- The public dataset is on Hugging Face
- The Stirrup harness is on GitHub